Document energy performance
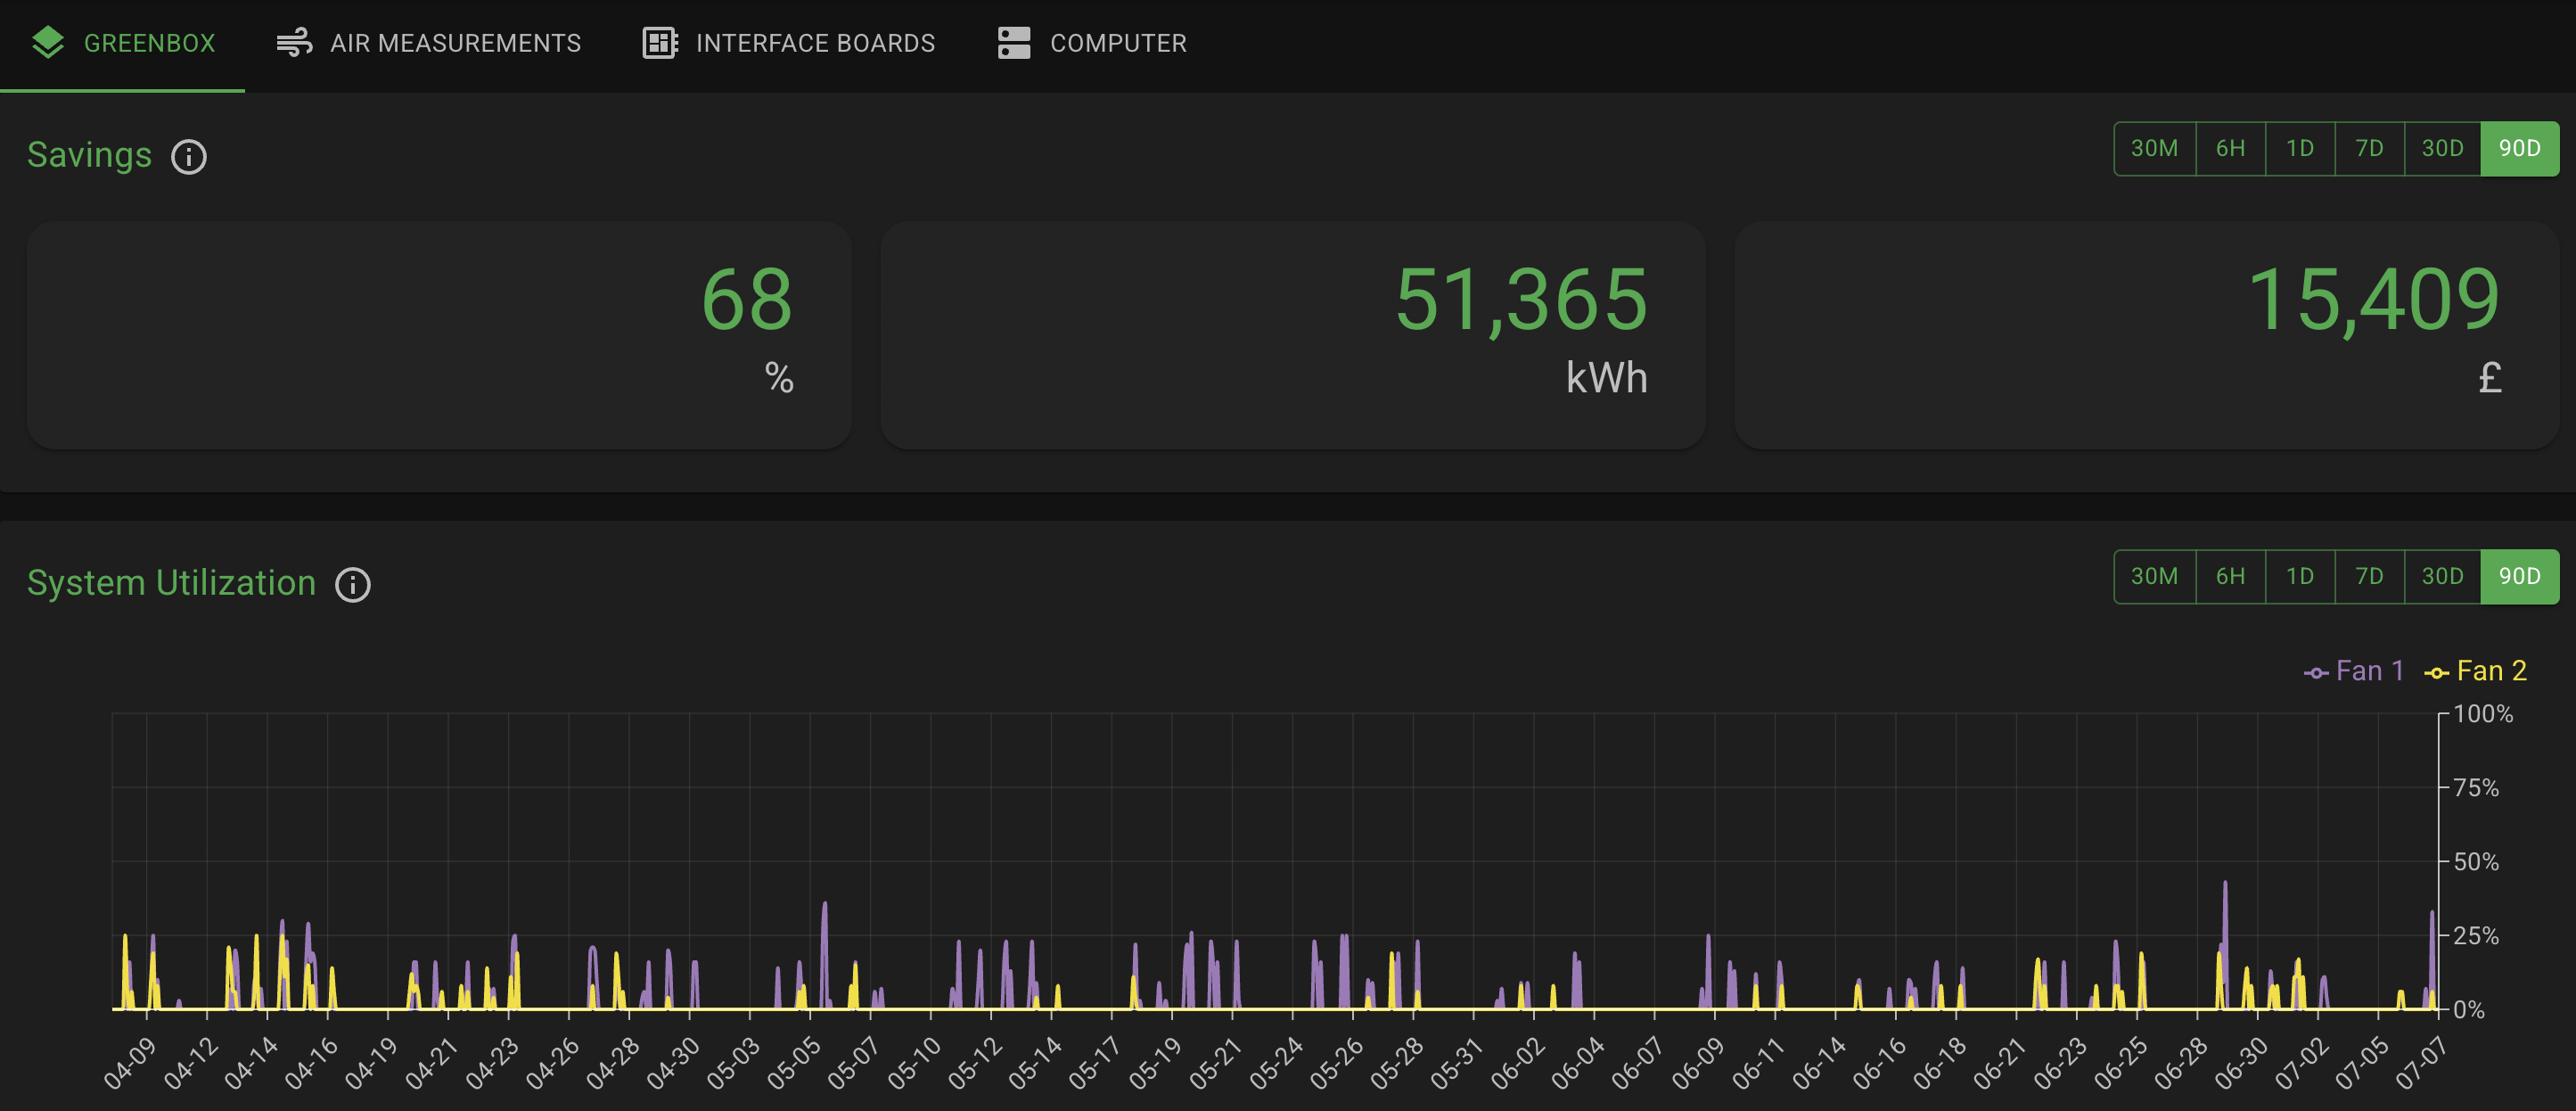
Compare measured fan power with the configured baseline and track accumulated kWh and cost savings over time.
Turn fan power, airflow, pressure, and workstation activity into documented savings, earlier maintenance insight, and better production decisions.
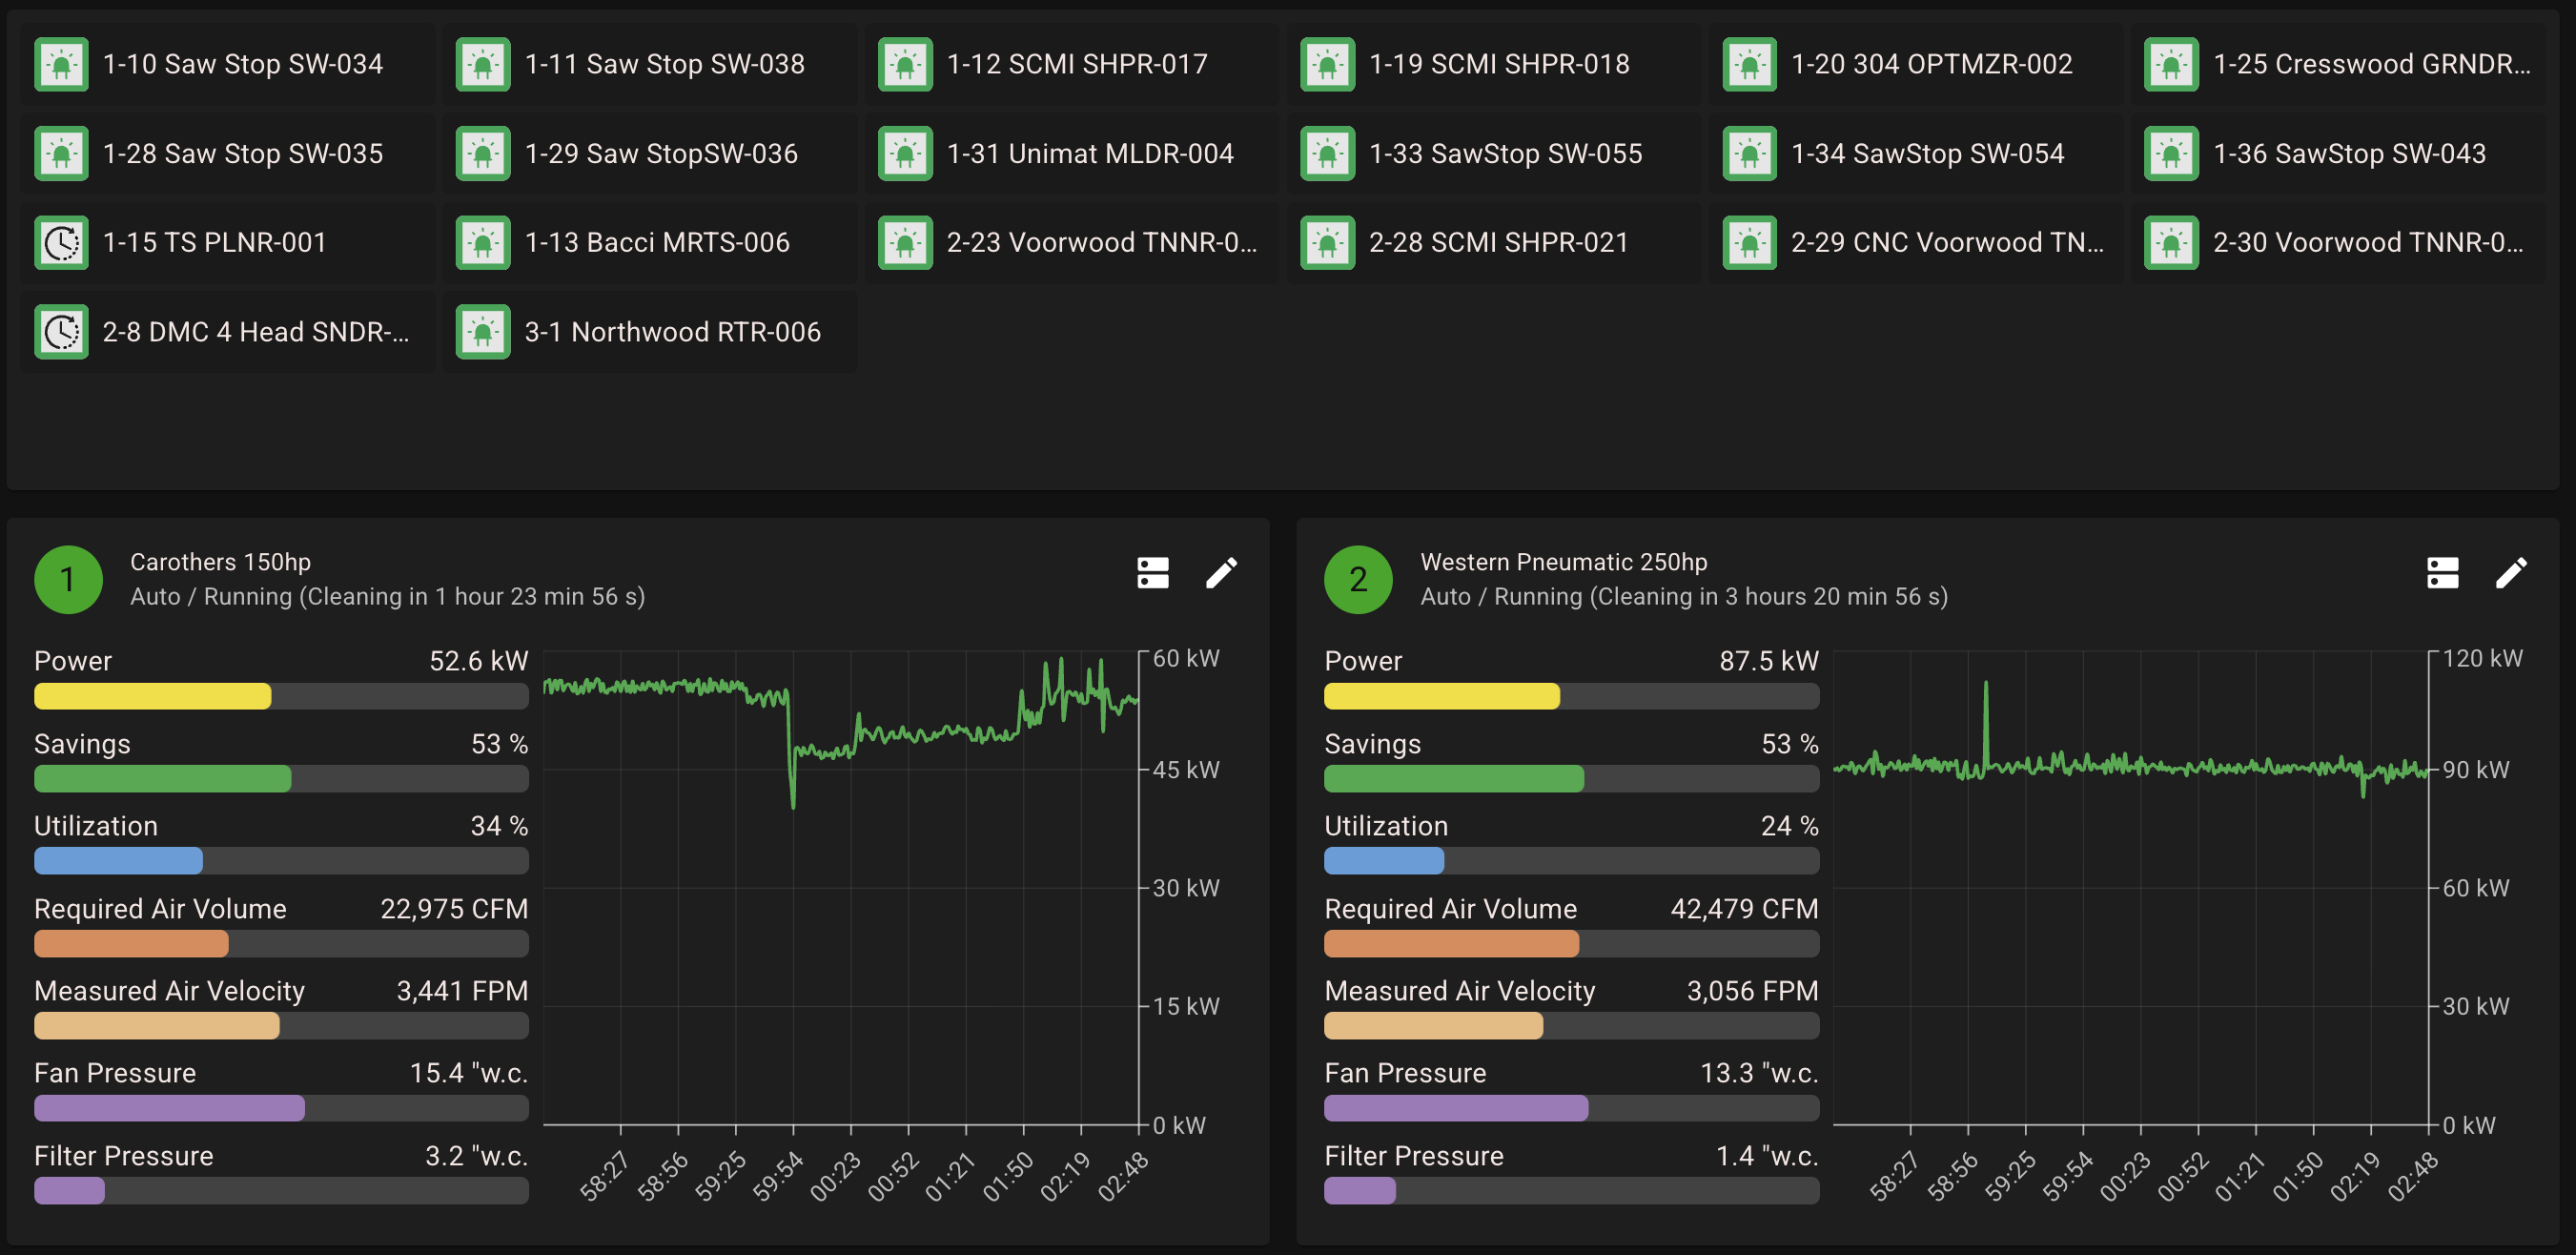
Ecogate combines machine activity, VFD power, gate status, air volume, velocity, and pressure into one connected operational picture.
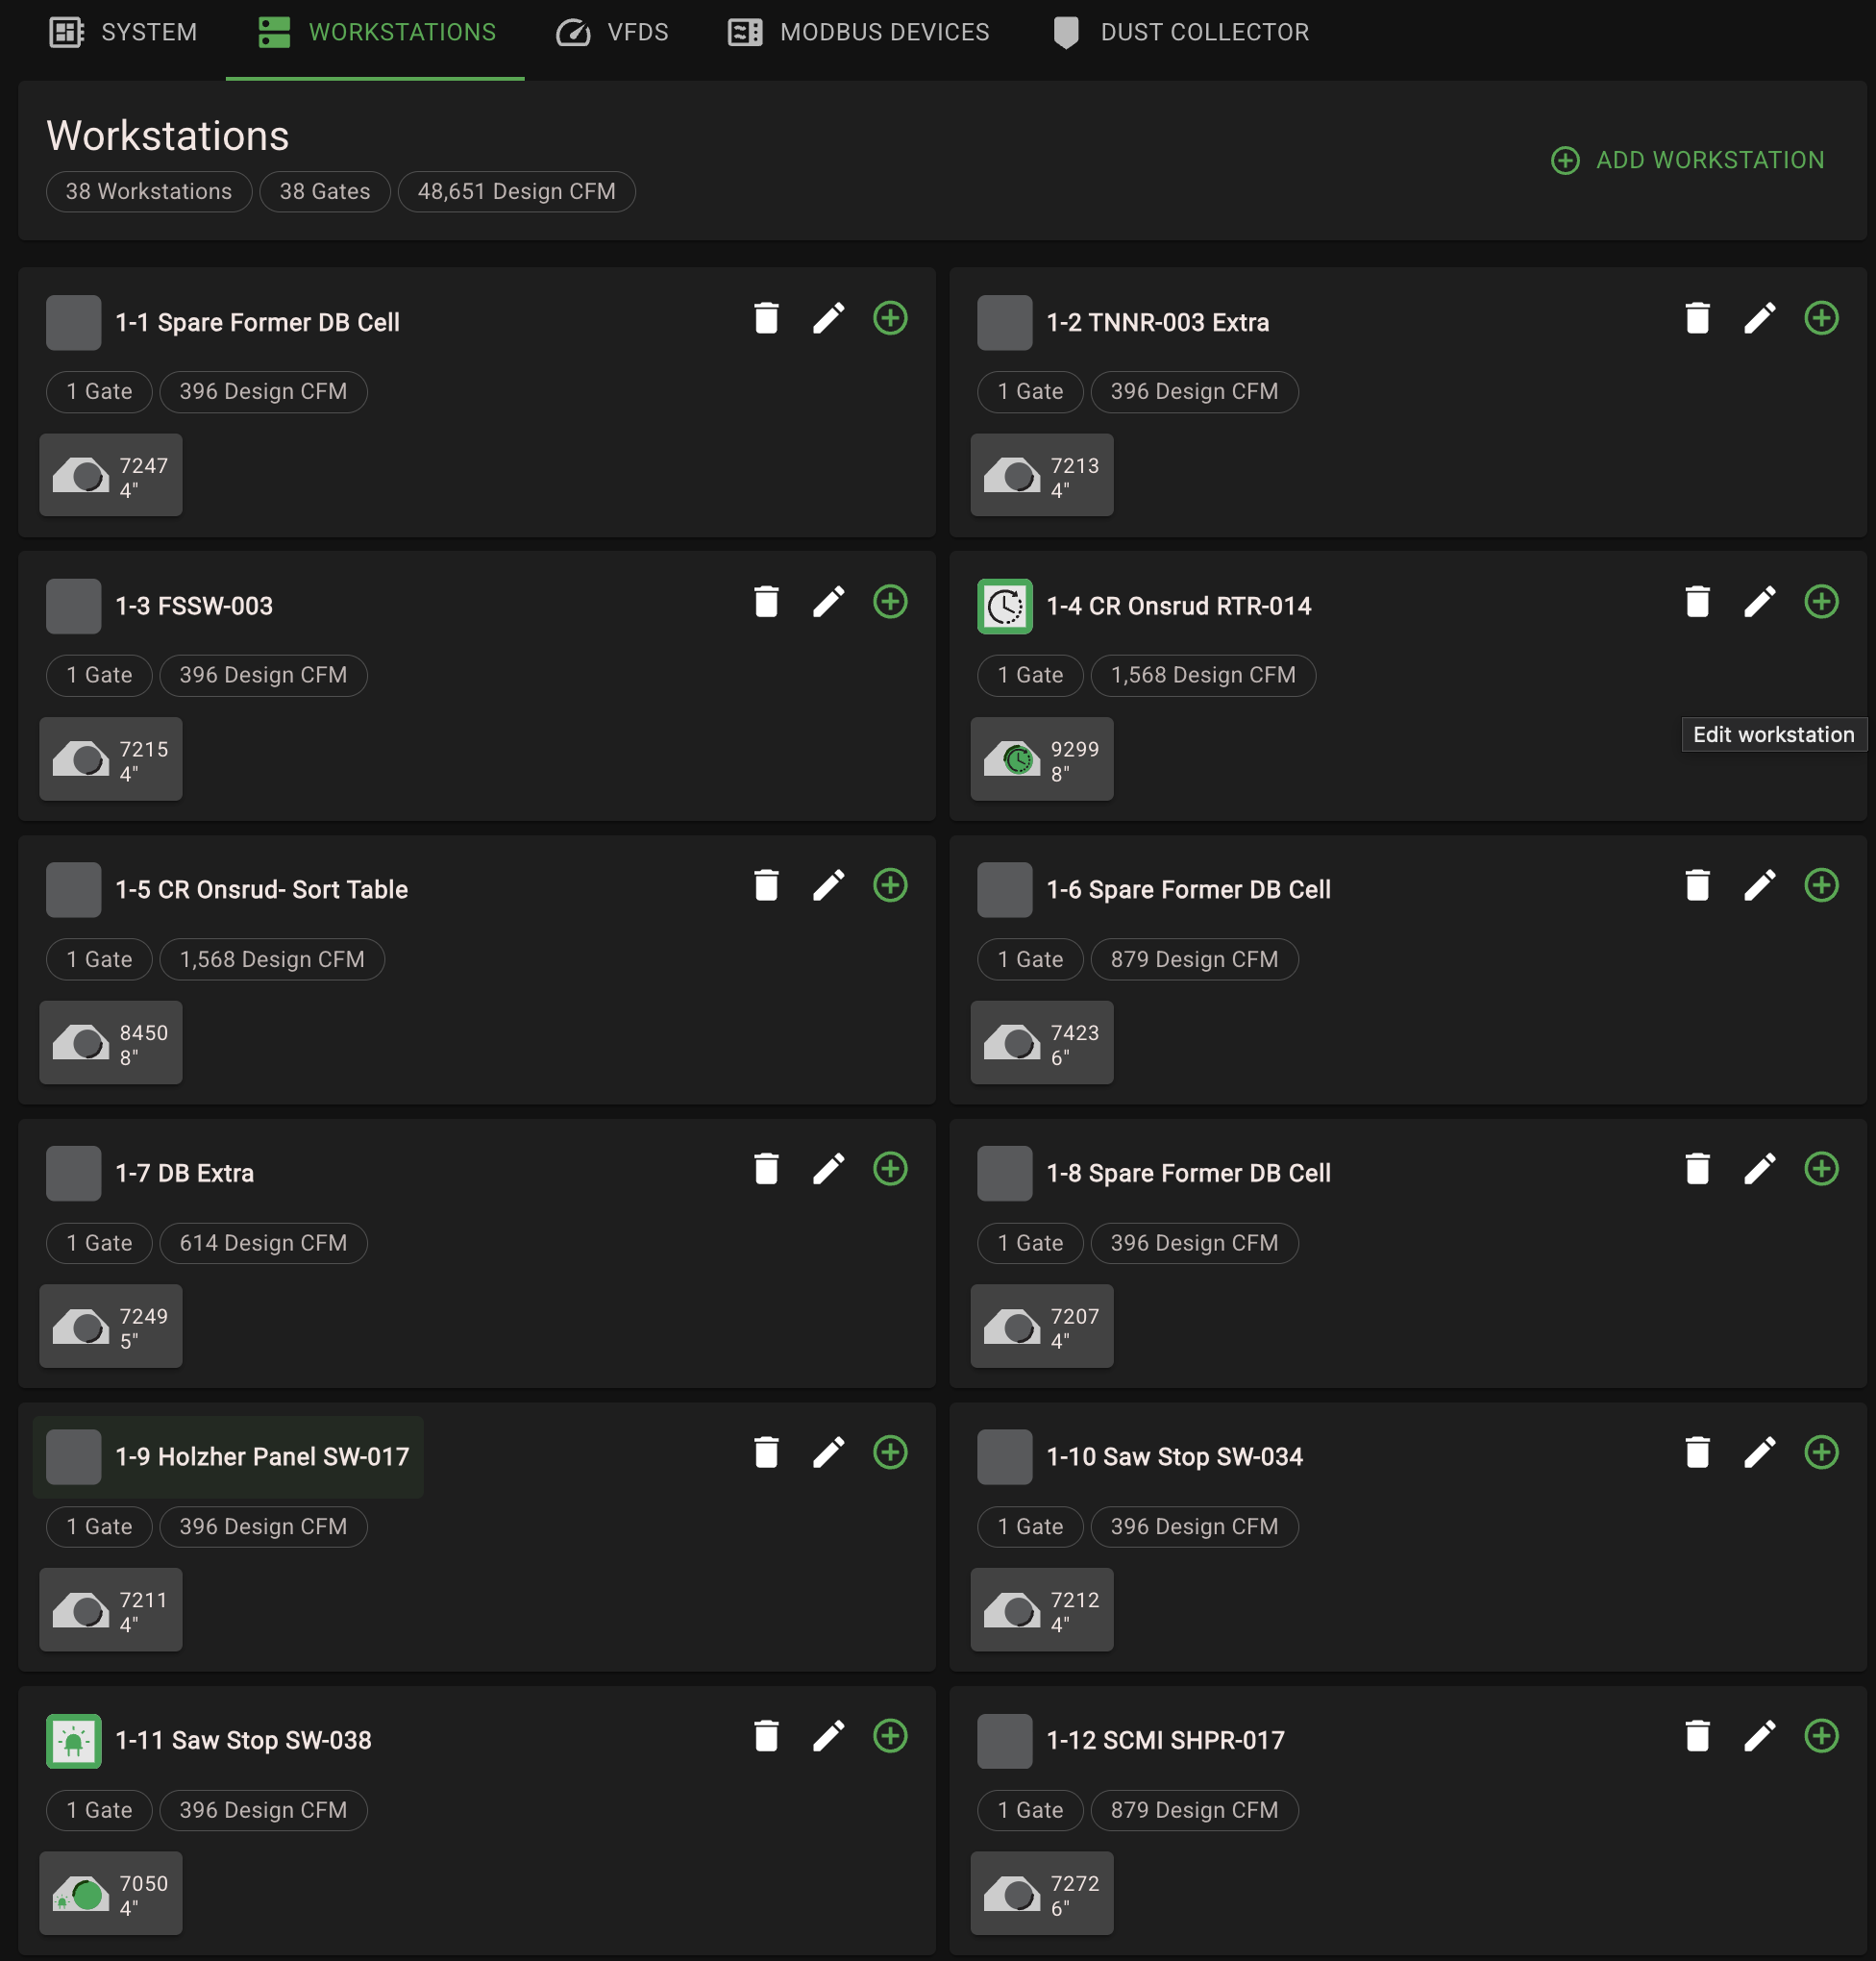
See which workstations are active and compare power, savings, utilization, required airflow, measured velocity, fan pressure, and filter pressure by system.
Review historical trends, daily email reports, monthly reports, and month-to-month comparisons. Export savings, utilization, airflow, and VFD power when deeper analysis is needed.
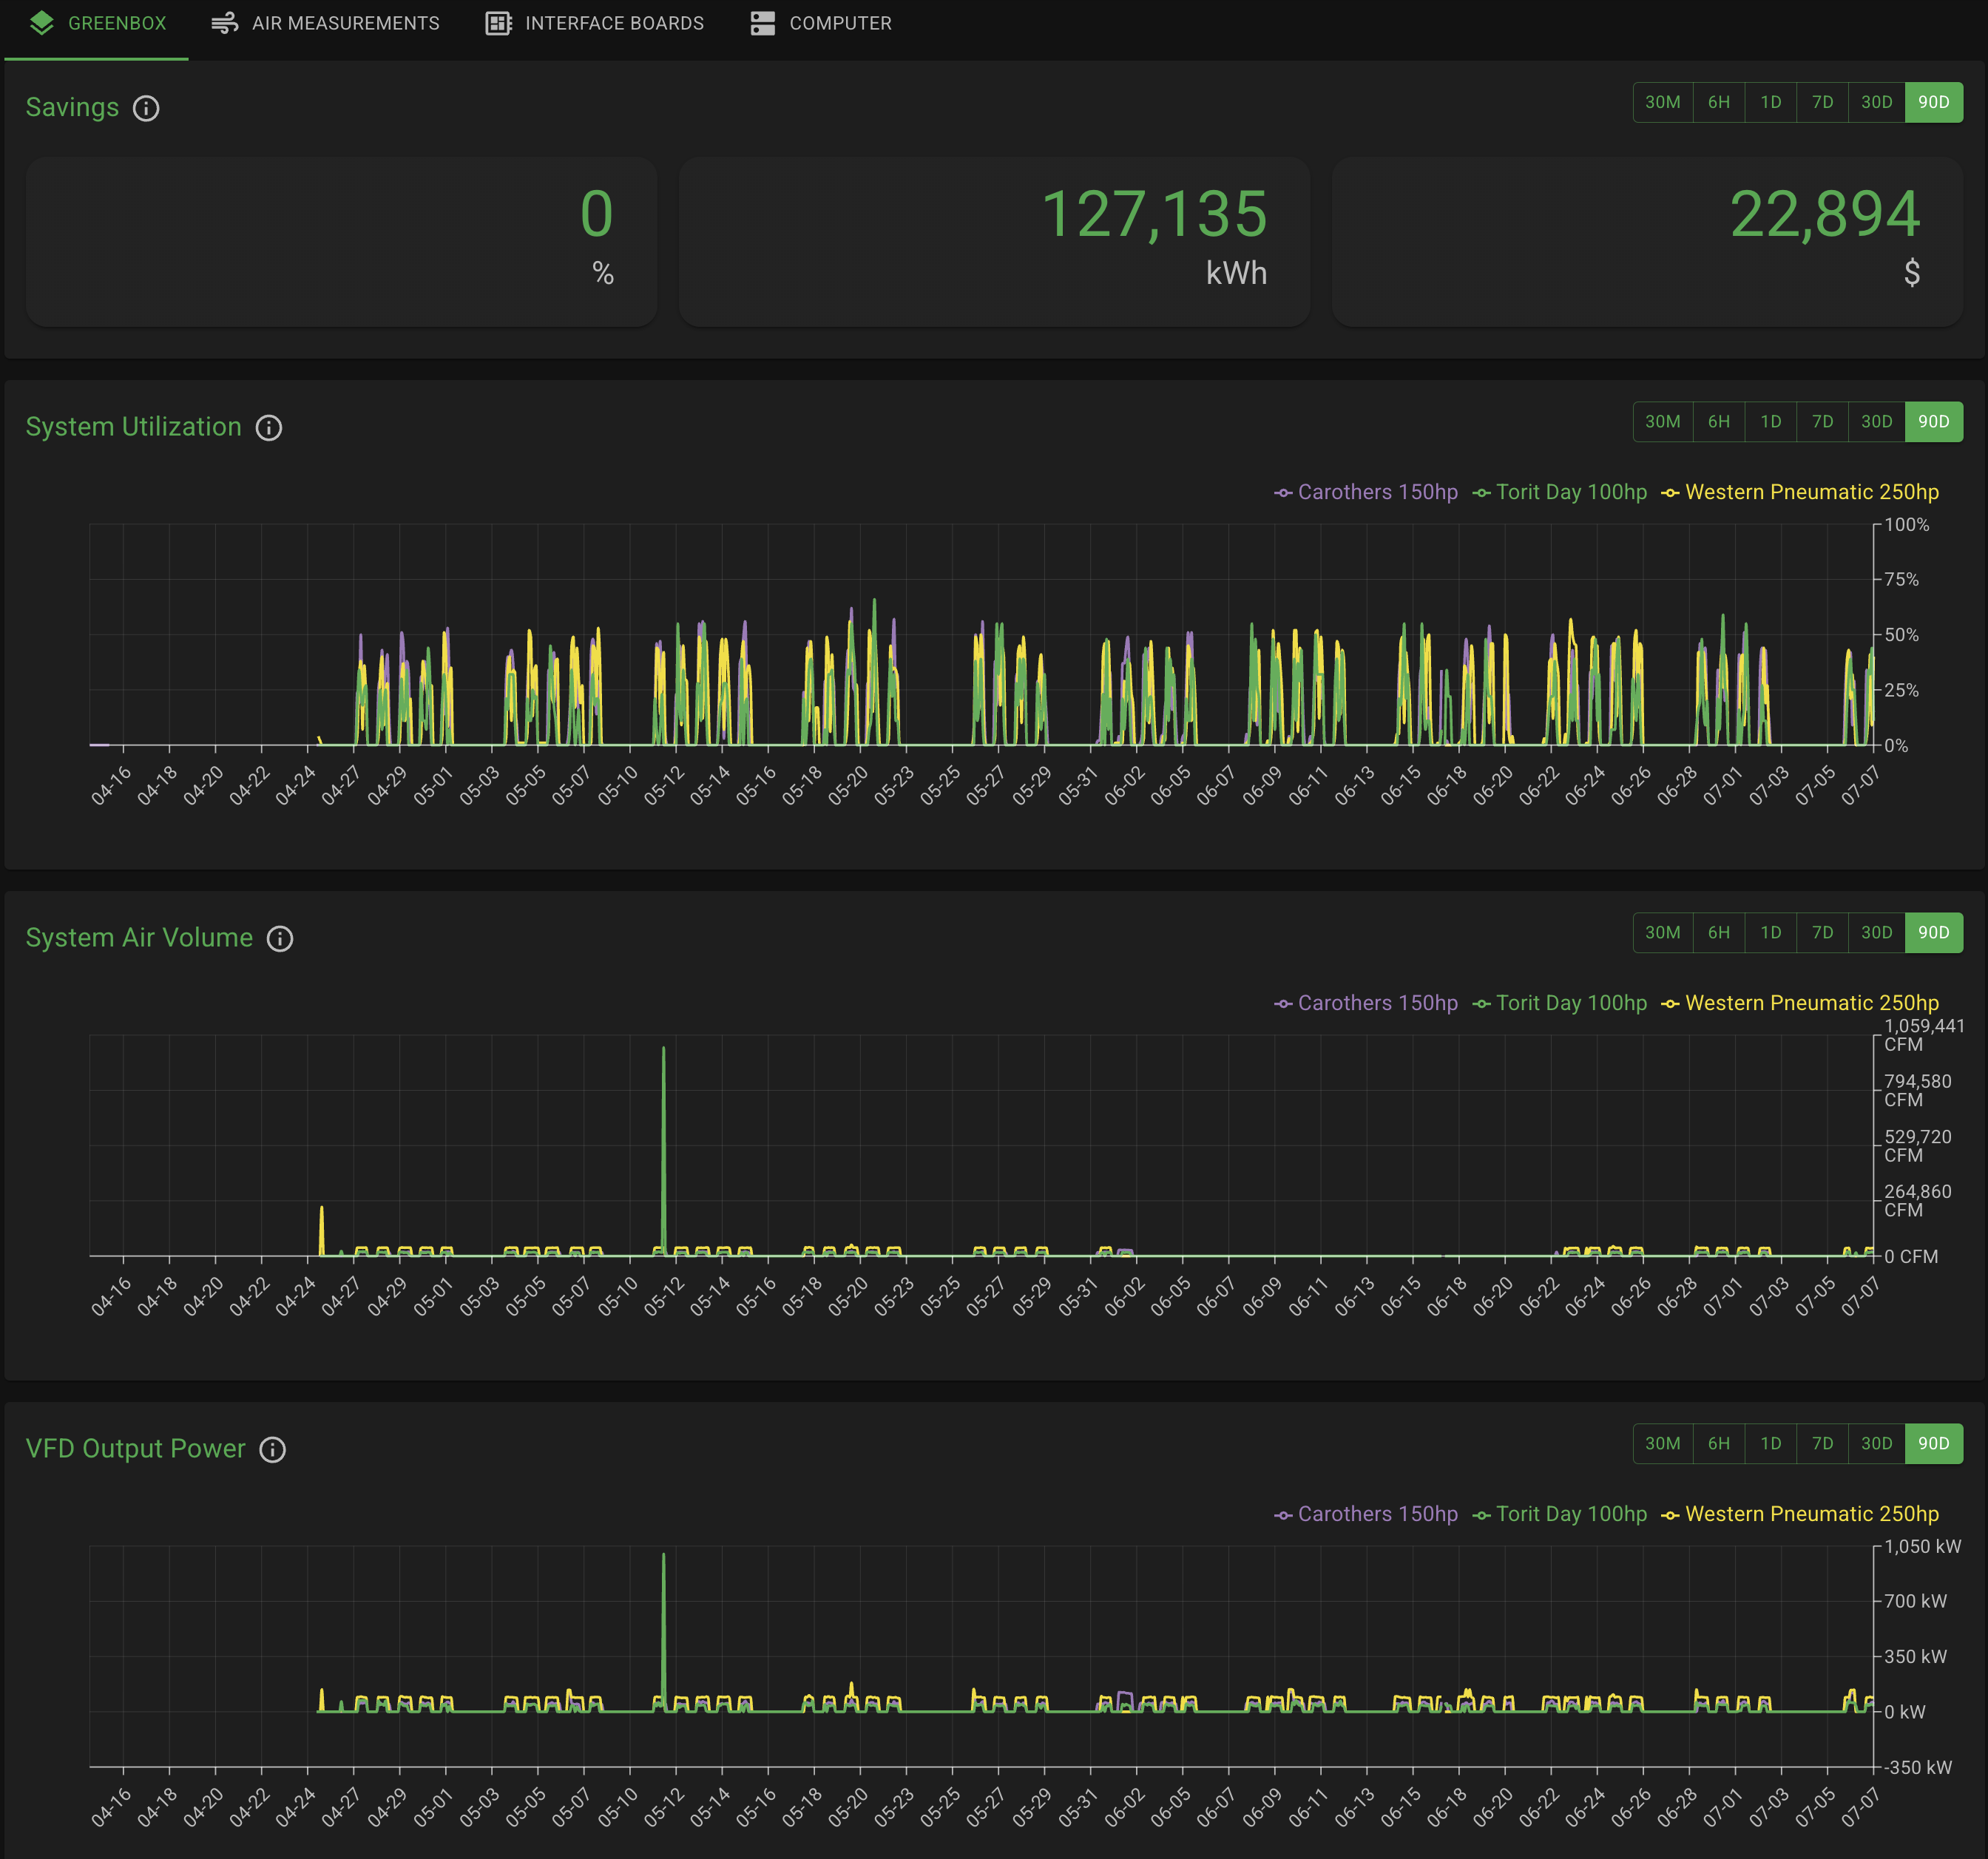
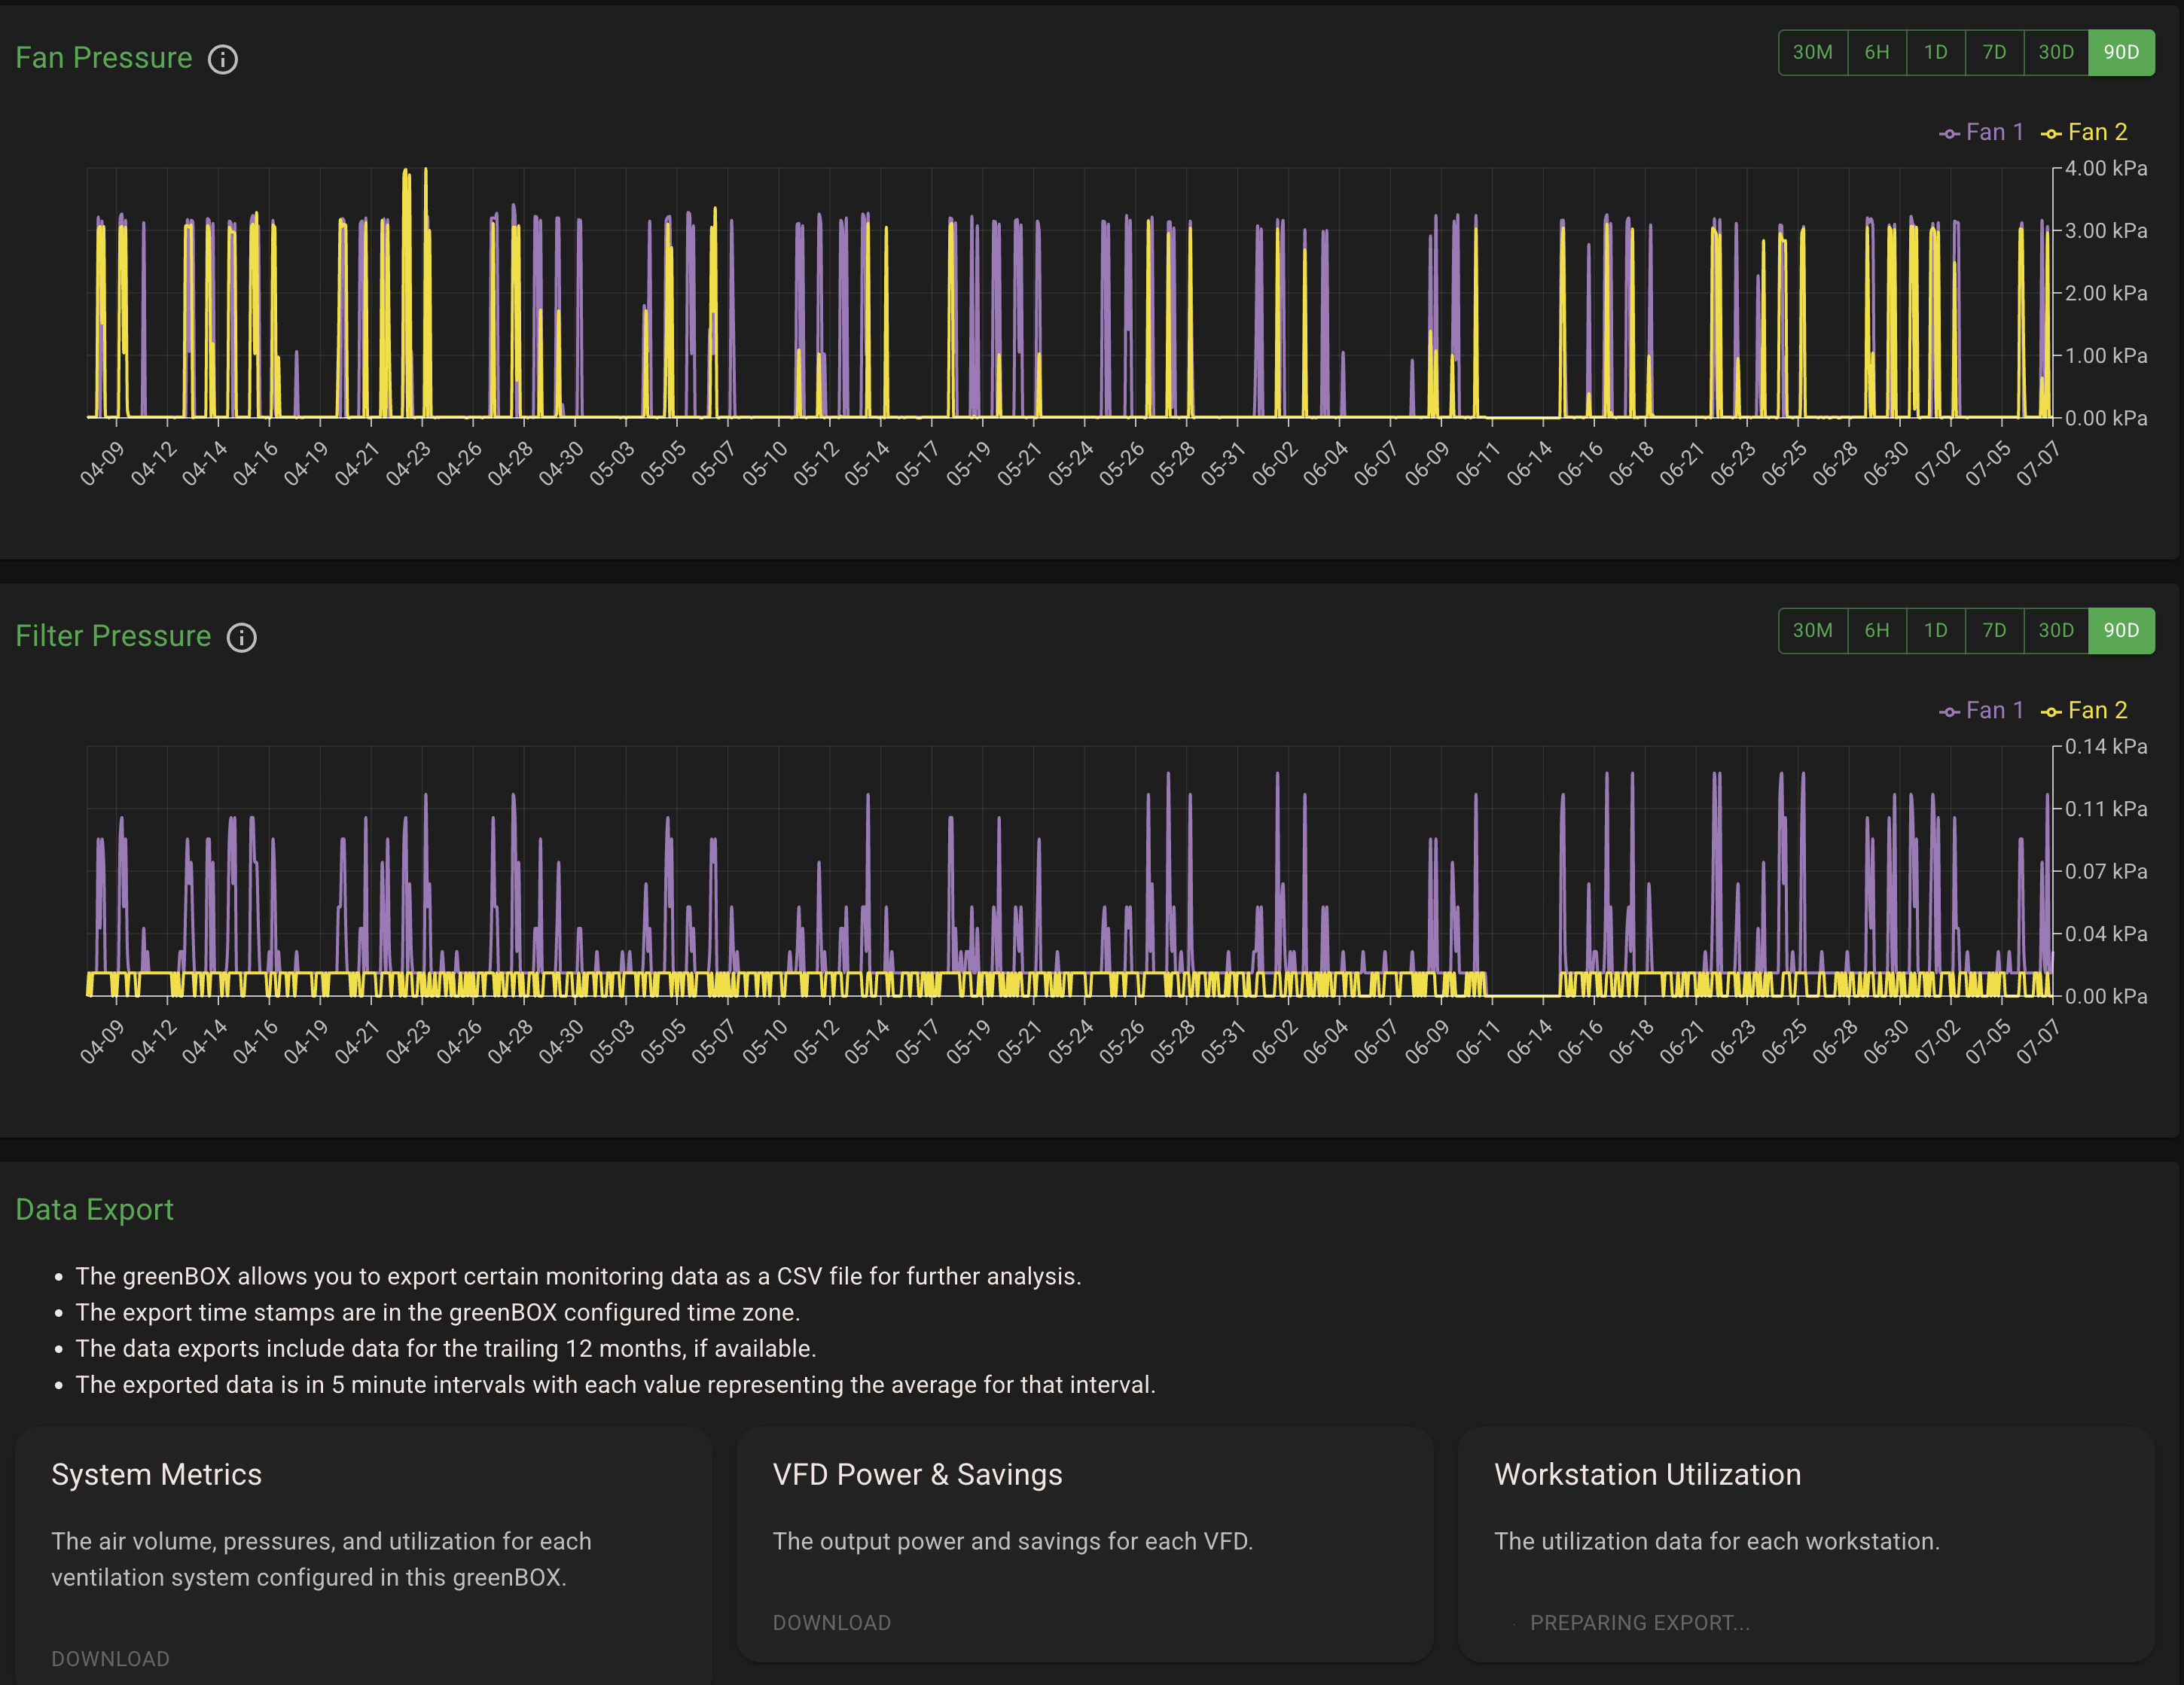
Trend fan and filter pressure, then export system metrics, VFD power and savings, or workstation utilization for deeper analysis and reporting.
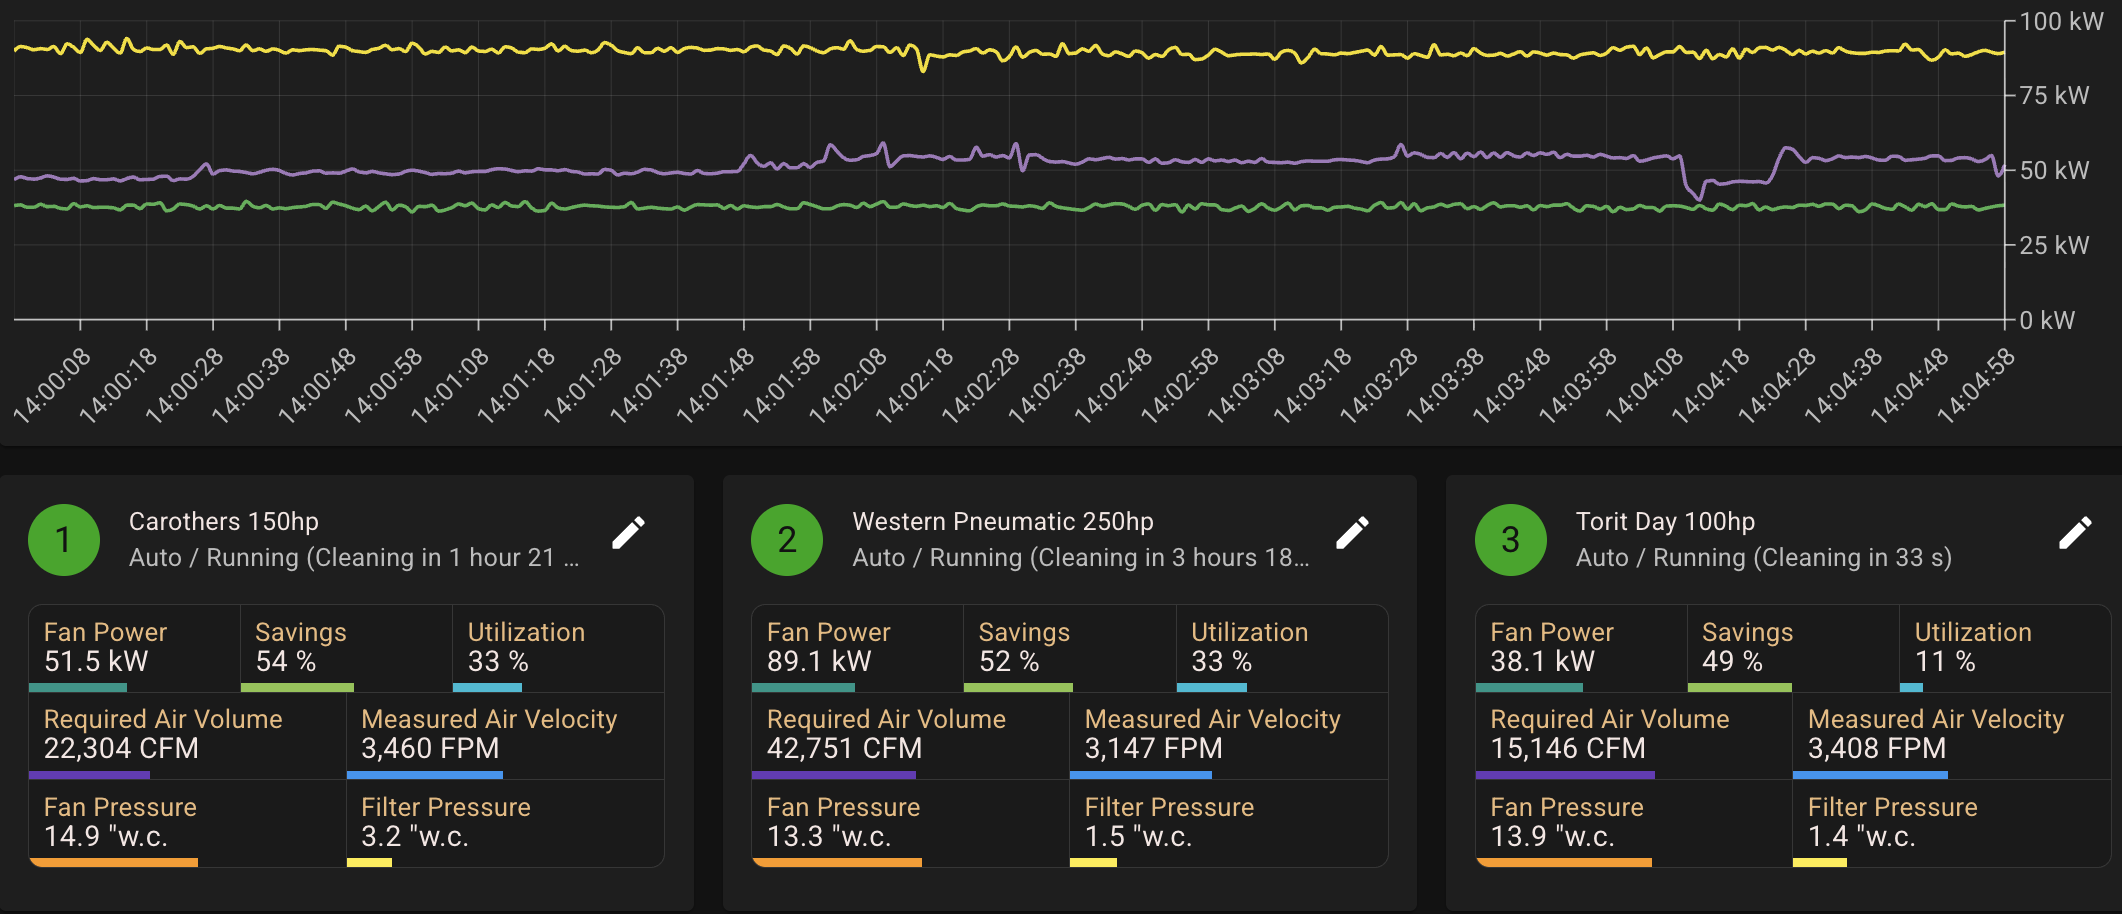
View current power trends alongside each system’s fan power, savings, utilization, required air volume, velocity, and pressure metrics.
The same operating data answers different questions for finance, maintenance, production, and engineering teams.
Compare measured fan power with the configured baseline and track accumulated kWh and cost savings over time.
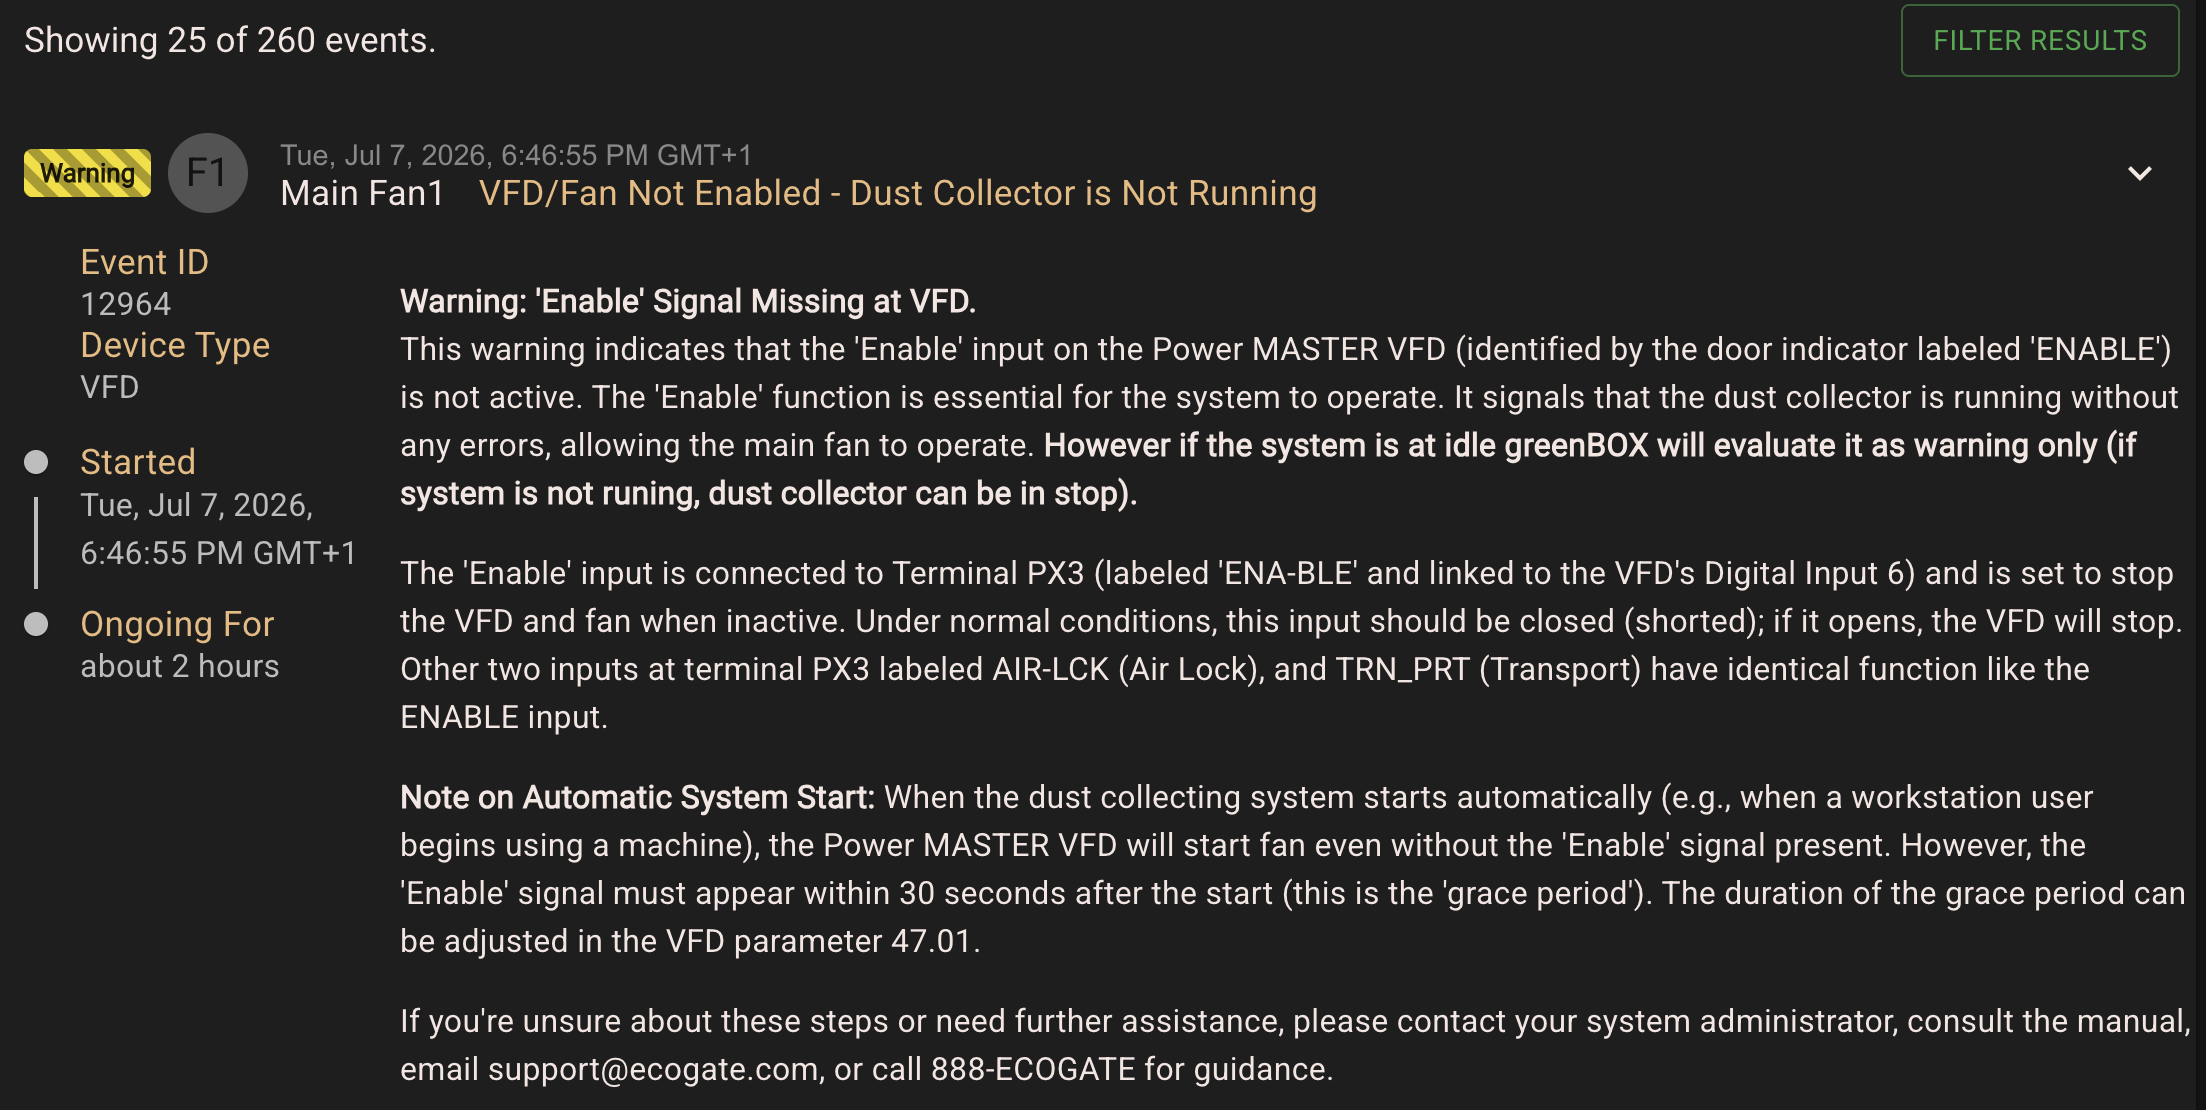
Track fan and filter pressure, system events, communication quality, and device measurements so maintenance teams can investigate changes sooner.
Identify which workstations are active or calling for collection, how often they run, and where layout, scheduling, or equipment decisions deserve a closer look.
Use measured operating patterns to support system changes, realistic peak-demand planning, airflow verification, and facility expansion decisions.
A senior engineer at a furniture manufacturer used Ecogate Analytics to discover that one of the factory's three table saws was utilized for only 3% of the shift. The team reorganized workflow and increased production without purchasing another saw.
Customer details anonymized for confidentiality.
Ecogate connects machine activity to gates, airflow, fan control, and reporting so the data reflects how the ventilation system is operating.
Detect when a workstation needs dust, fume, or mist collection.
Report status and, where equipped, measured pressure, velocity, and volume.
Coordinates demand, airflow requirements, connected devices, and system logic.
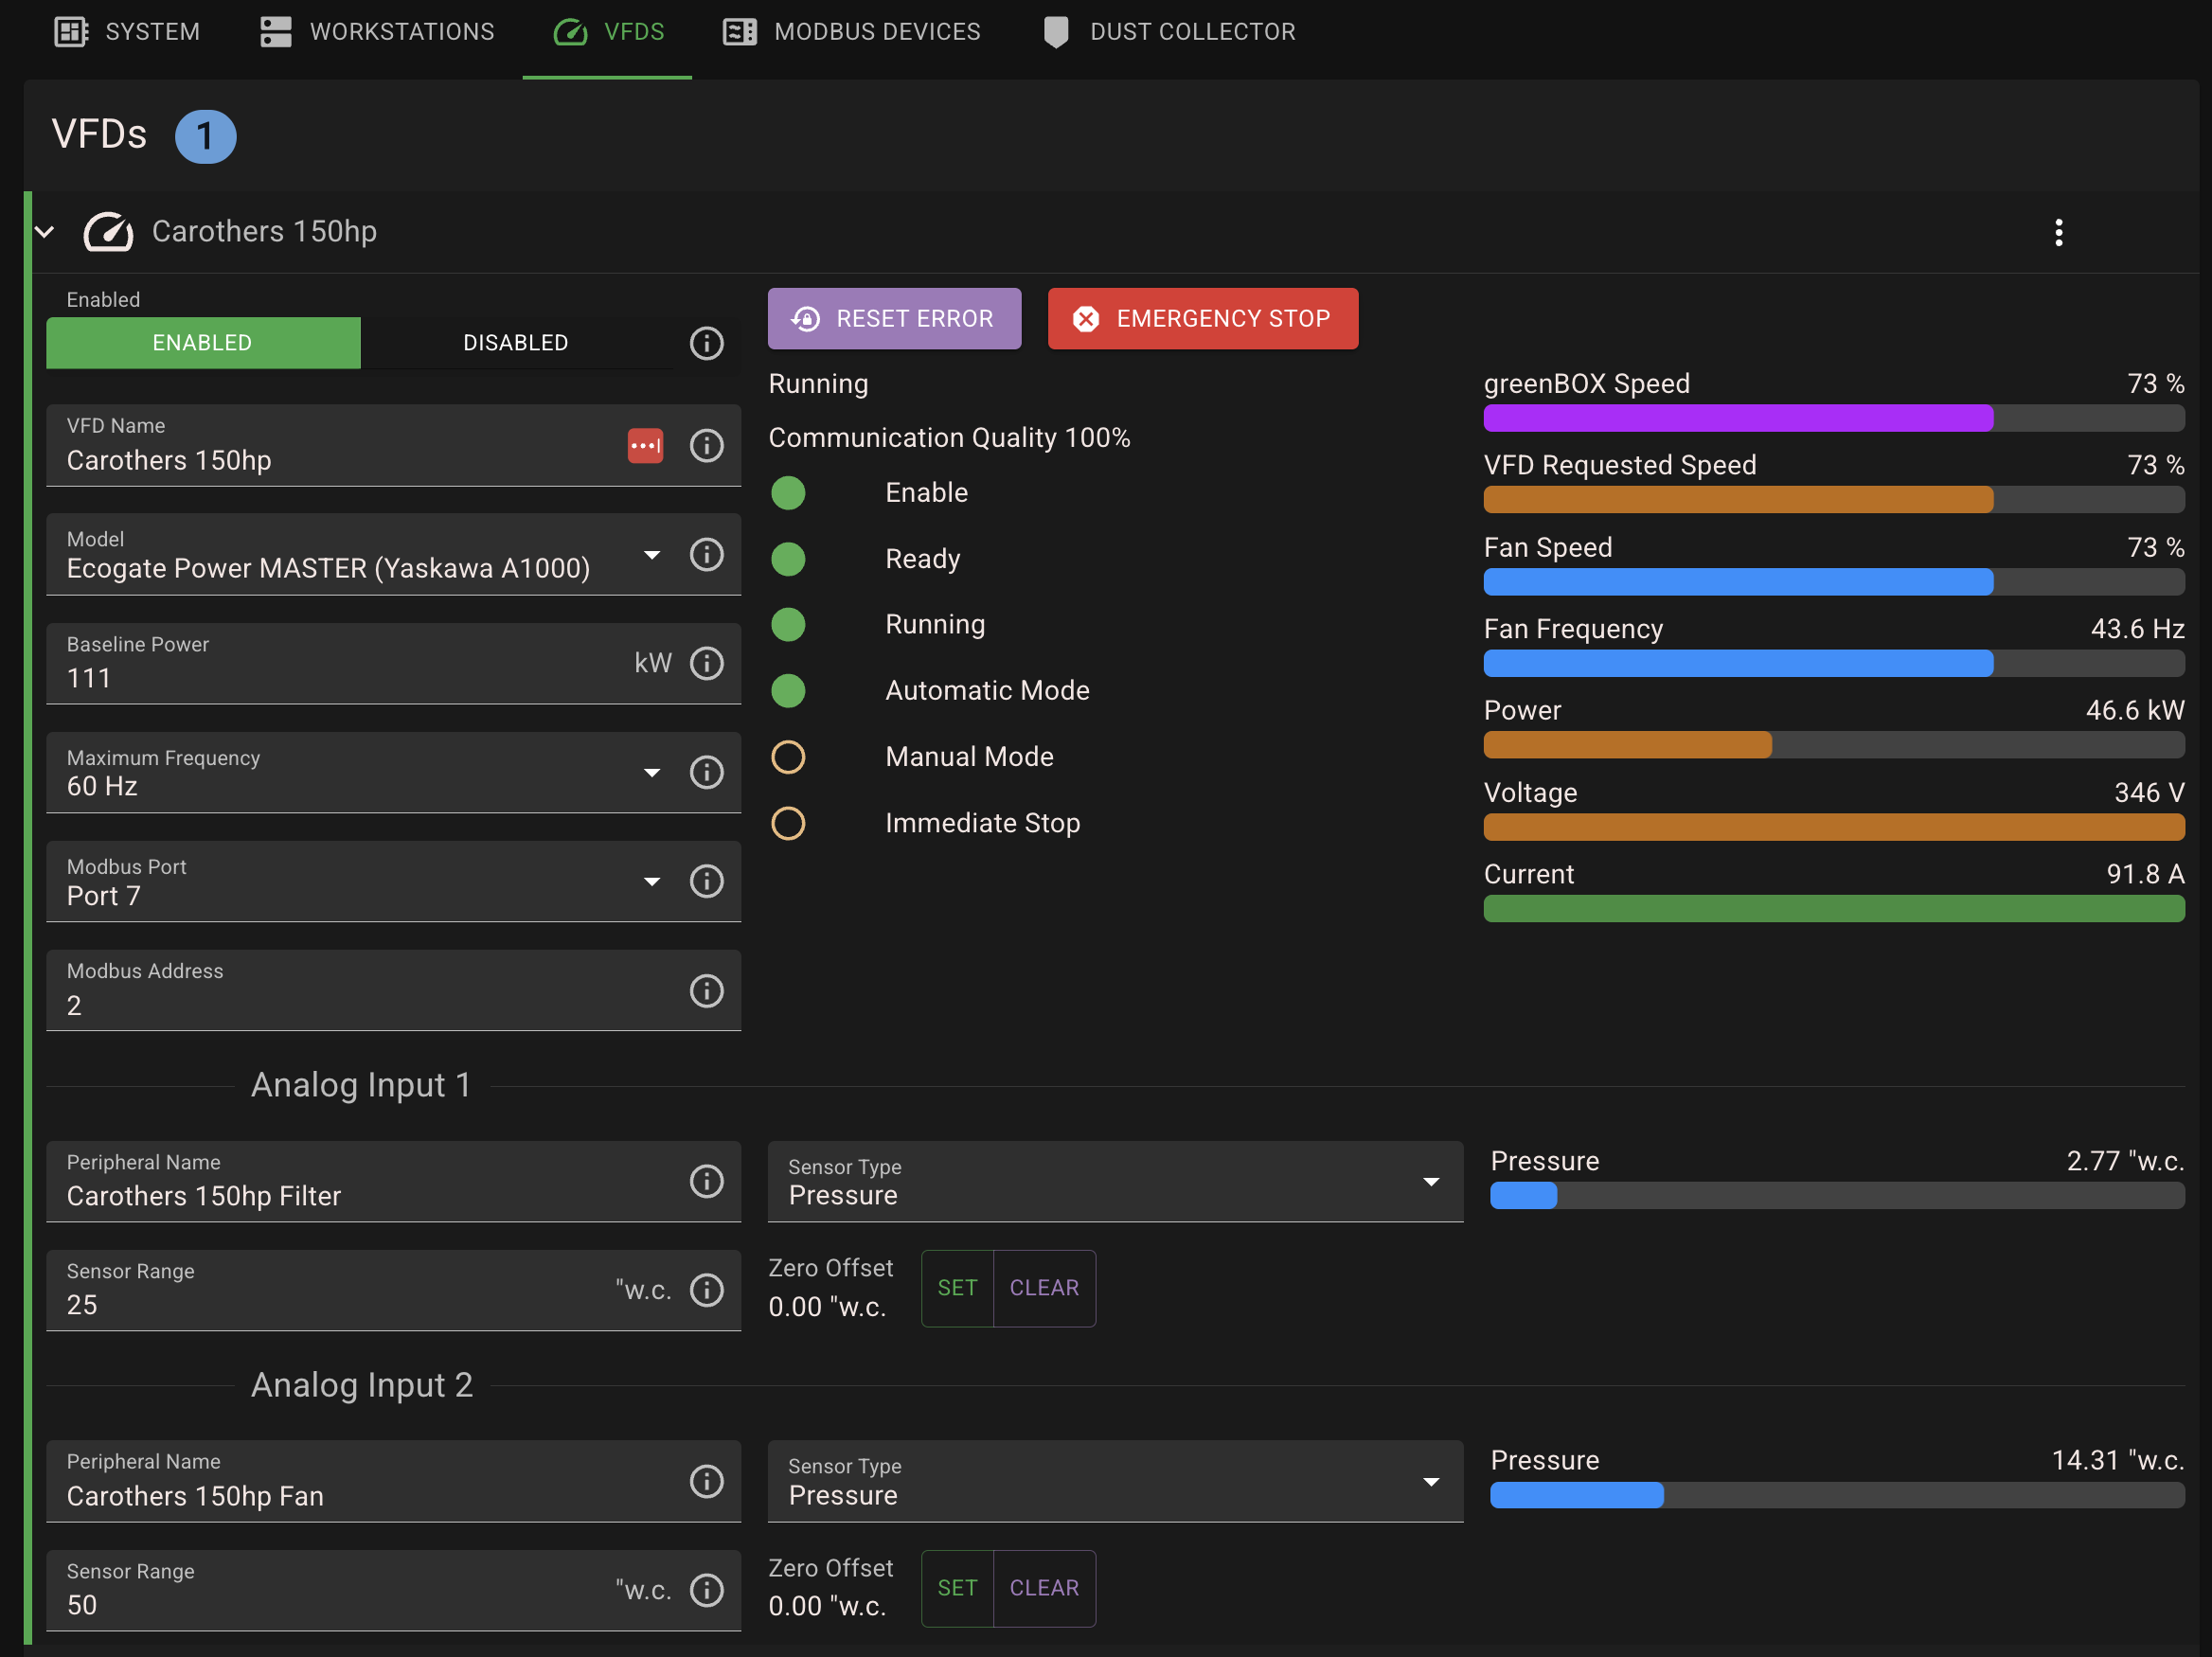
Adjusts fan speed and reports measured VFD power back to the system.
Turns system data into live views, history, summaries, and exports.
Available measurements depend on system configuration, connected sensors, gate type, and calibration.
Ecogate software runs on EcogateOS, with analytics available through the greenBOX interface and the Ecogate Analytics cloud platform. Automatic airflow calibration streamlines commissioning and duct changes, while interactive listboxes configure filter warnings, pressure limits, low-air-volume alerts, and other I/O behavior—without custom programming.
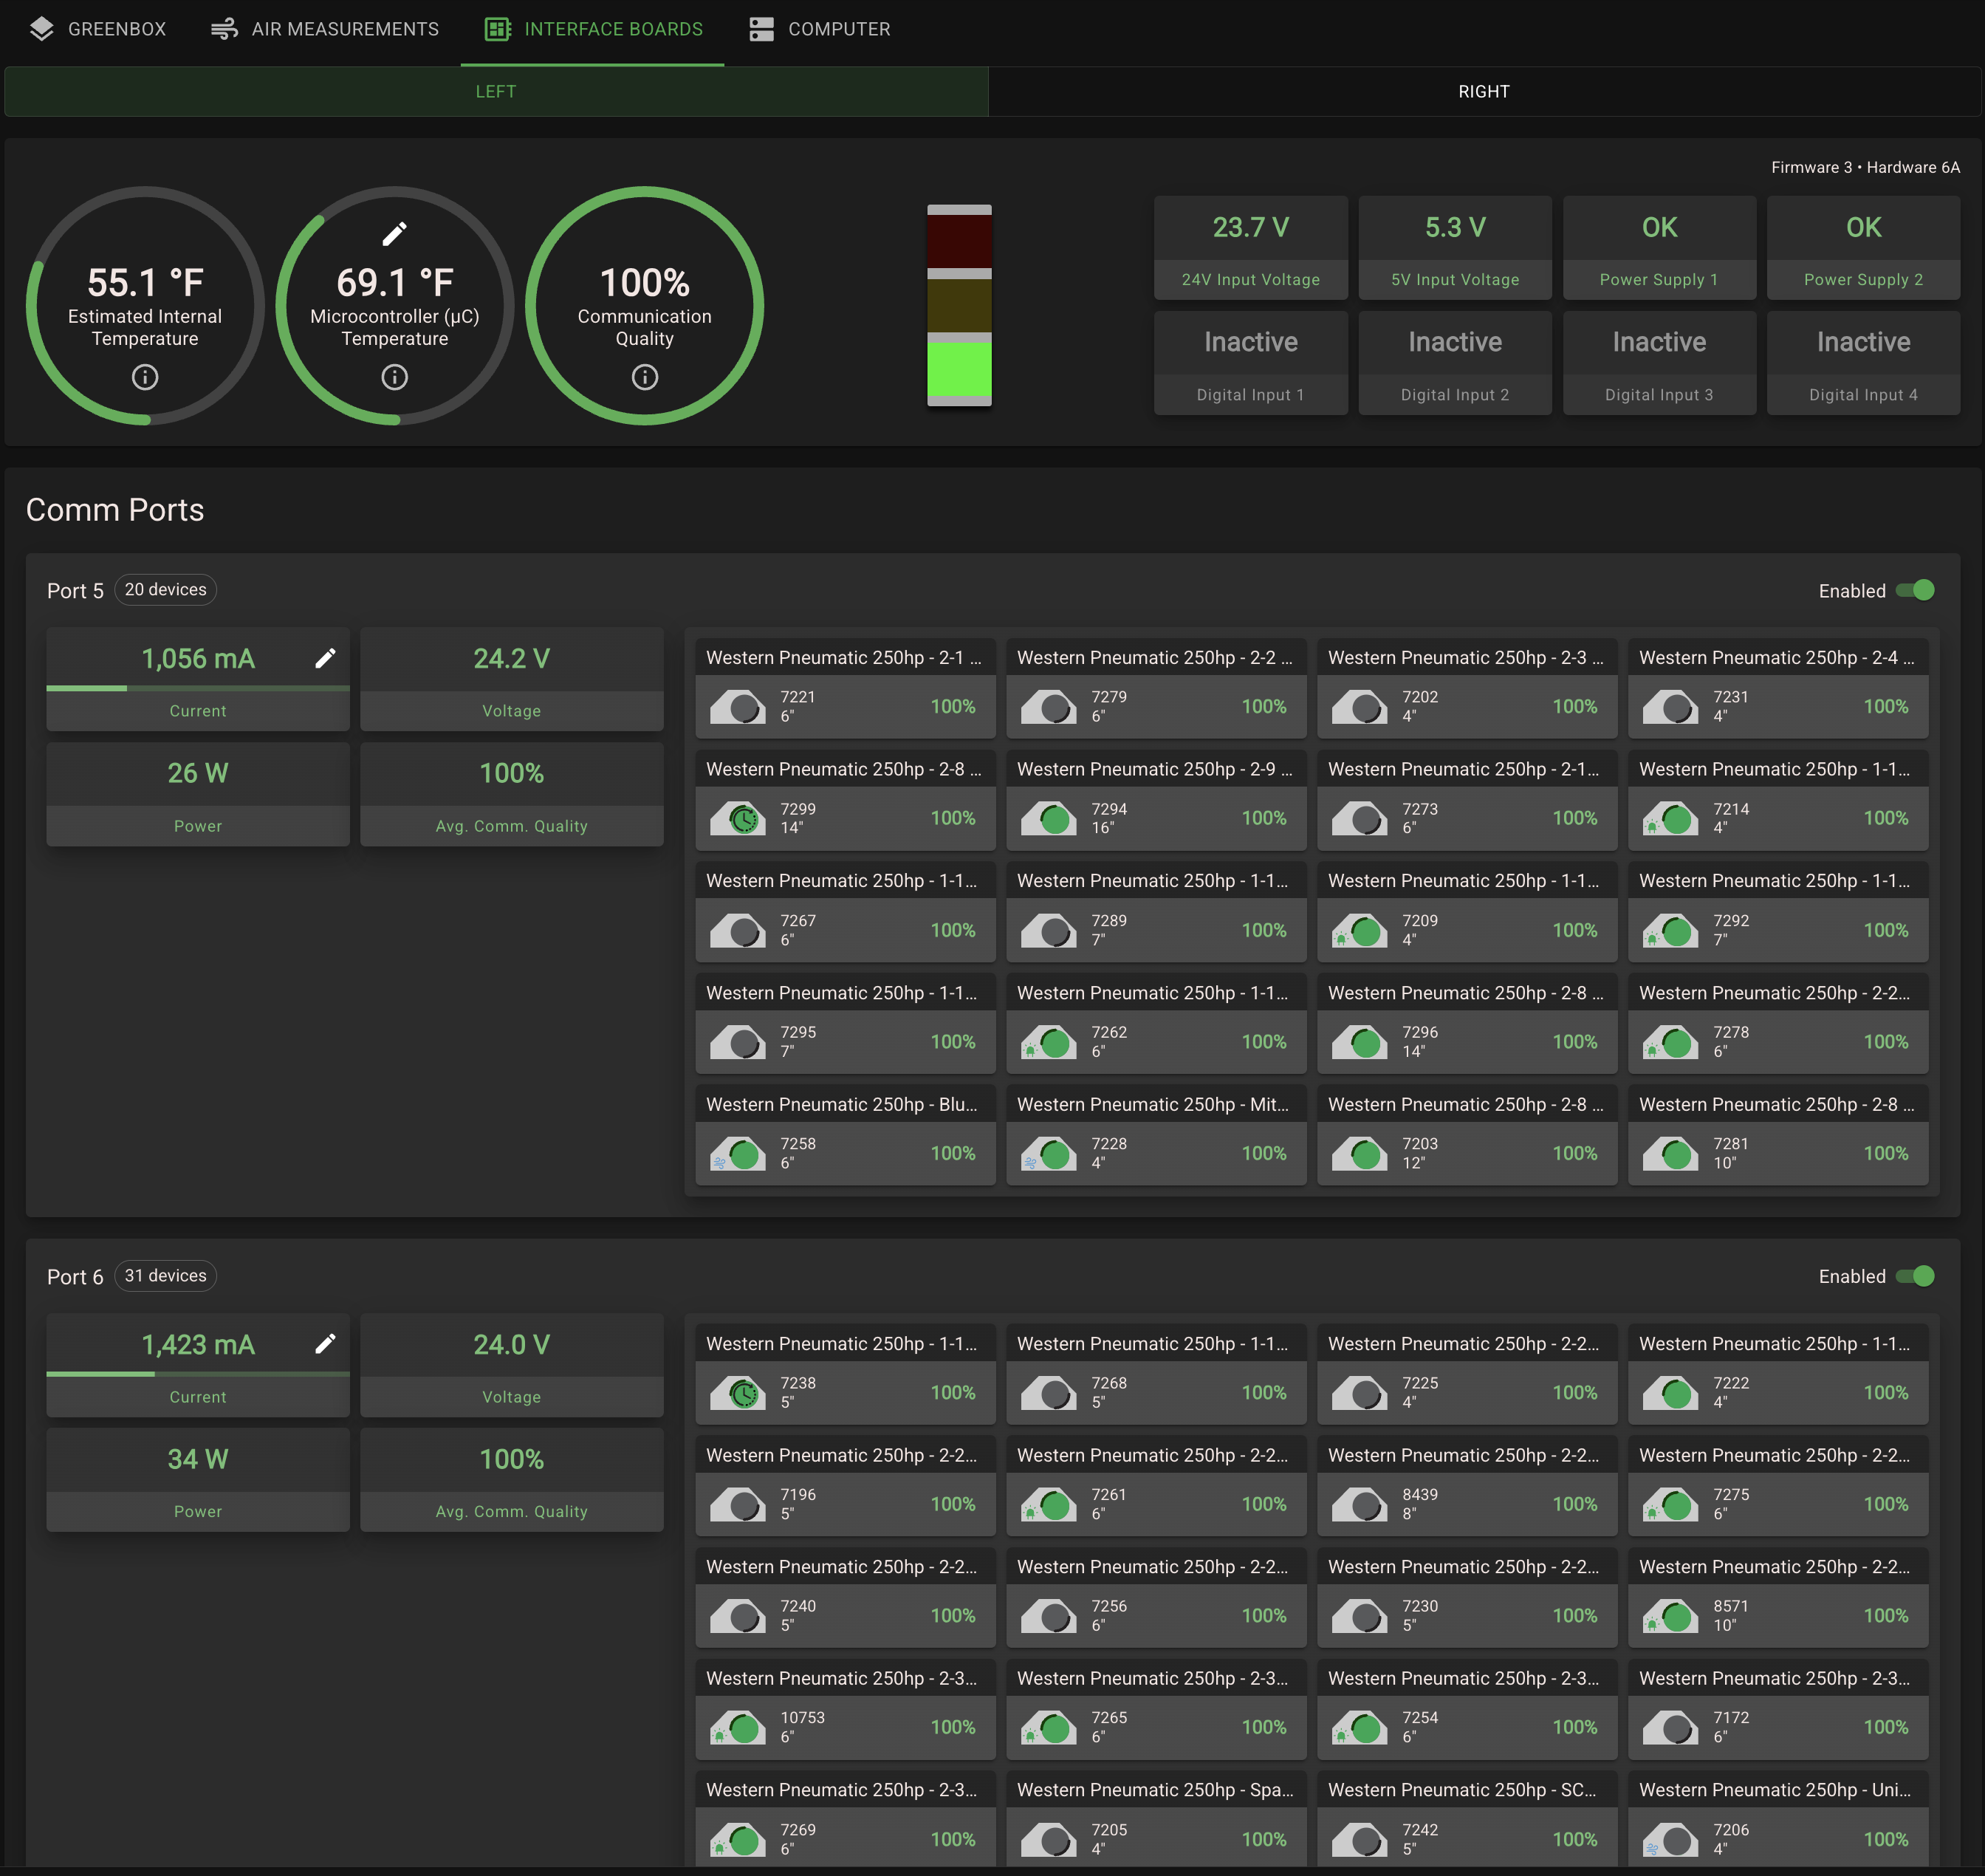
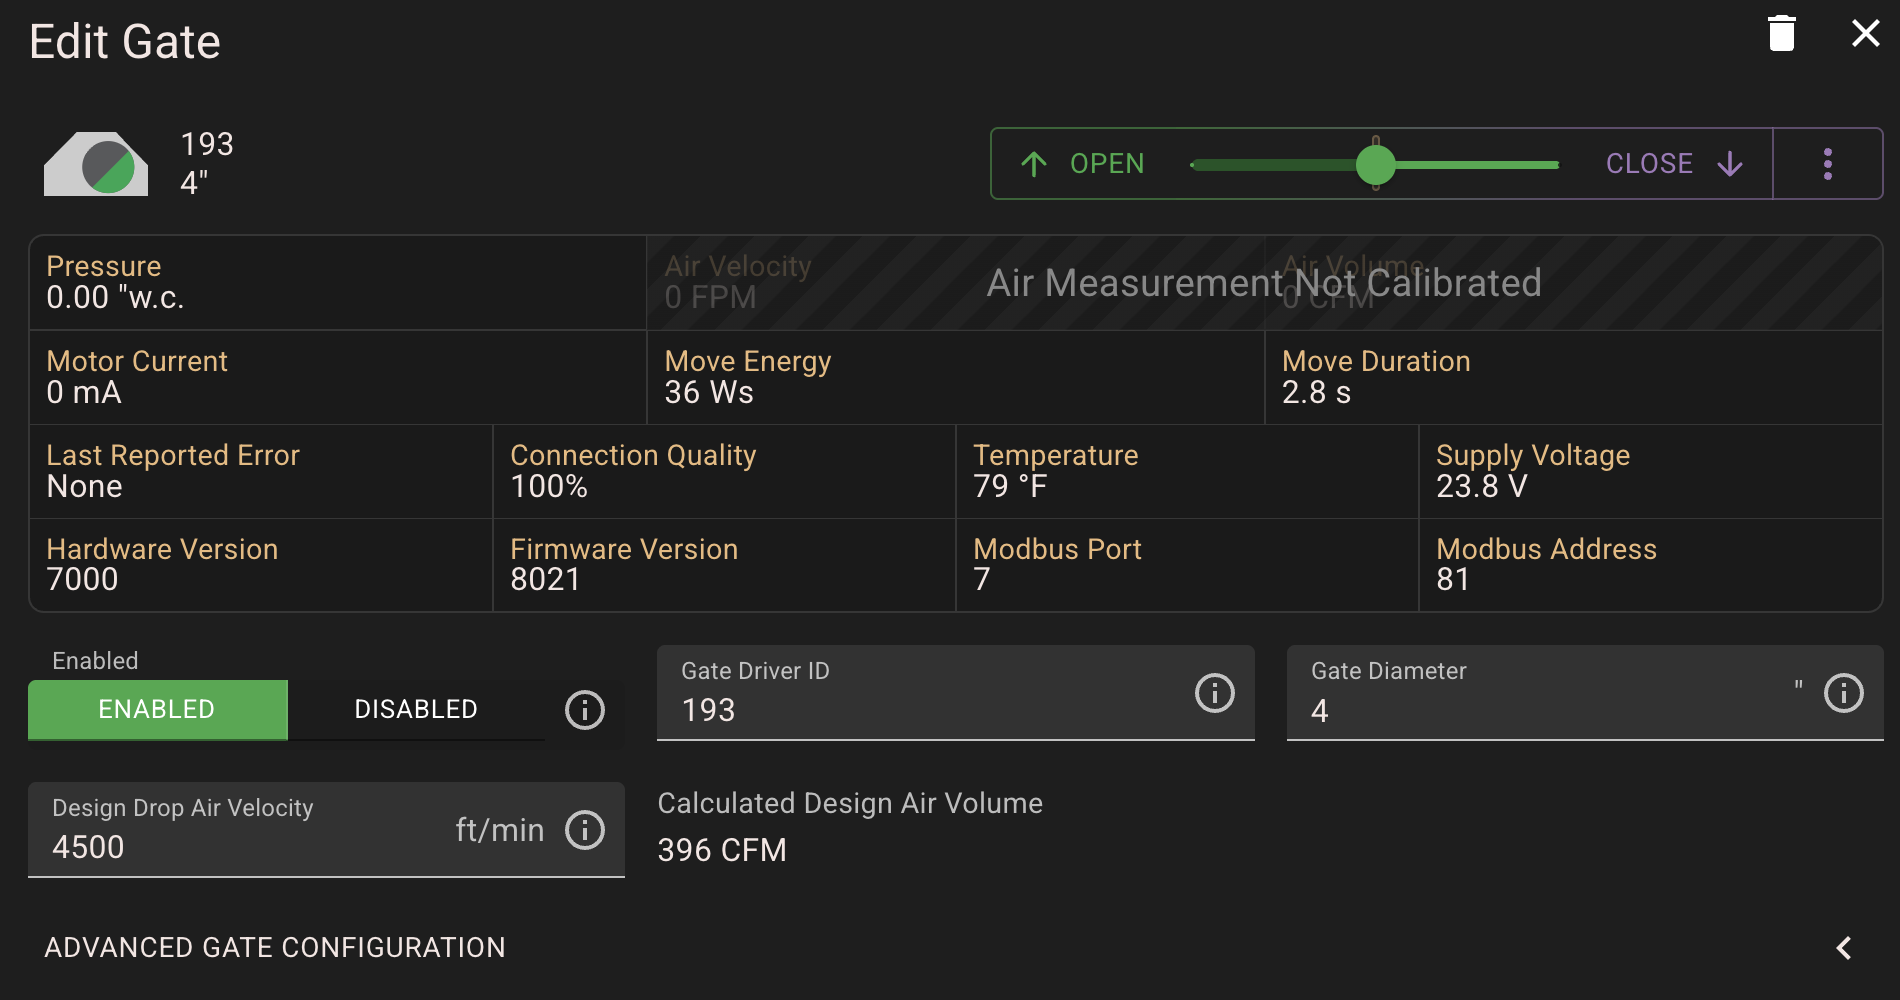
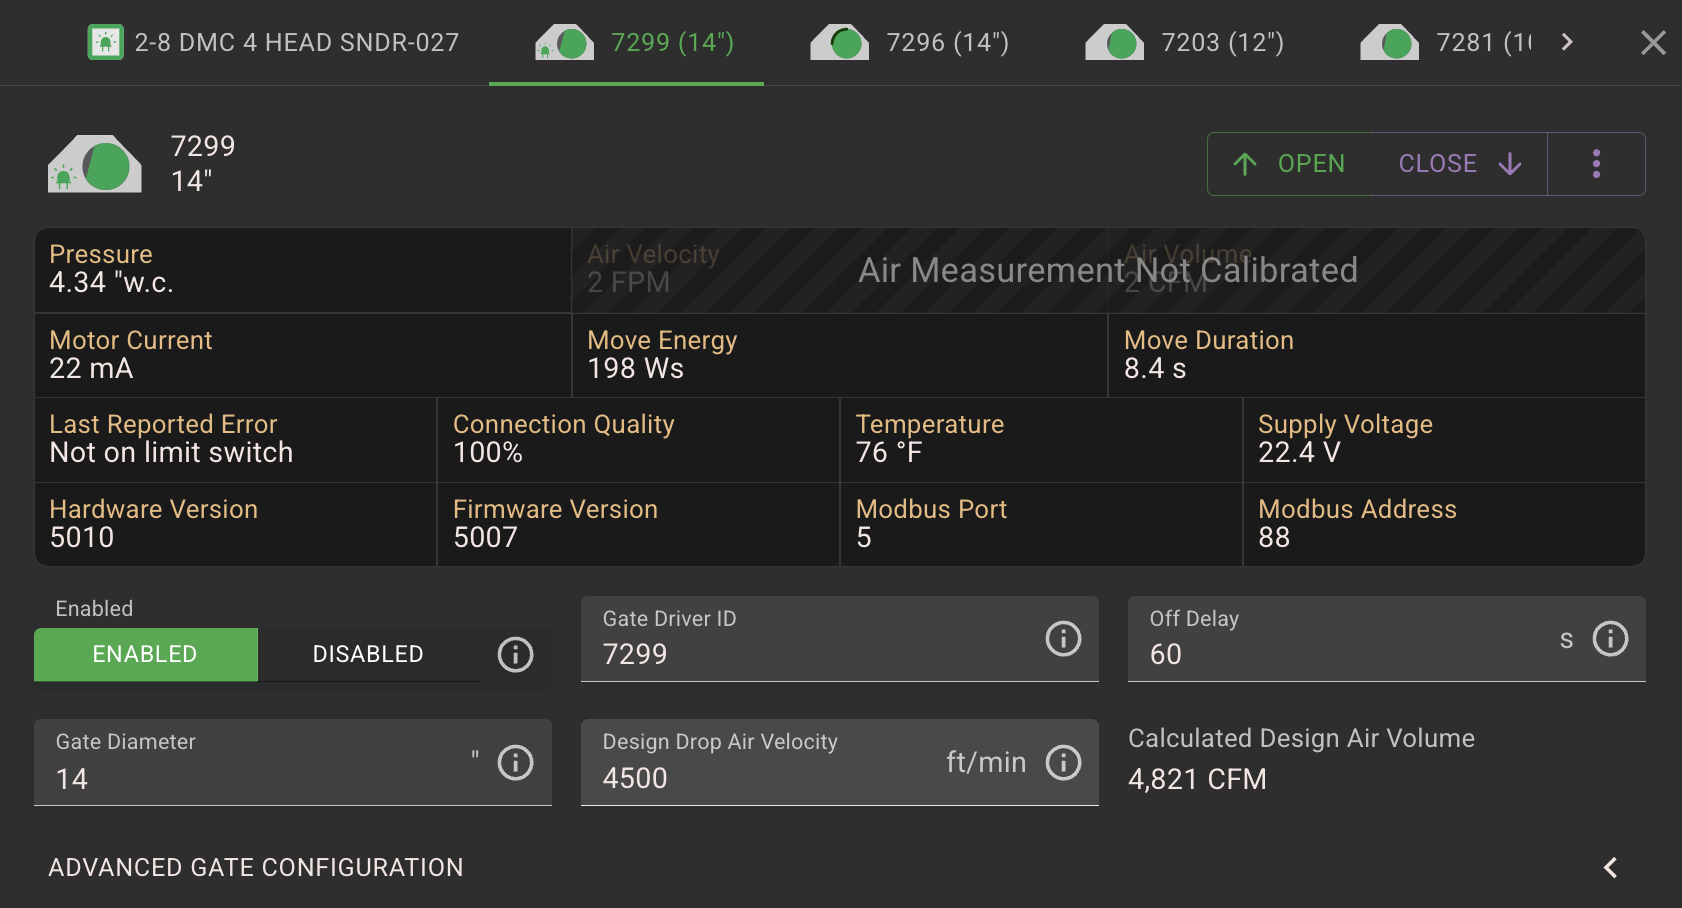
EcogateOS uses encrypted communications and a security-first remote access architecture. Access is governed by customer user accounts and role-based Ecogate service access.
Review network security →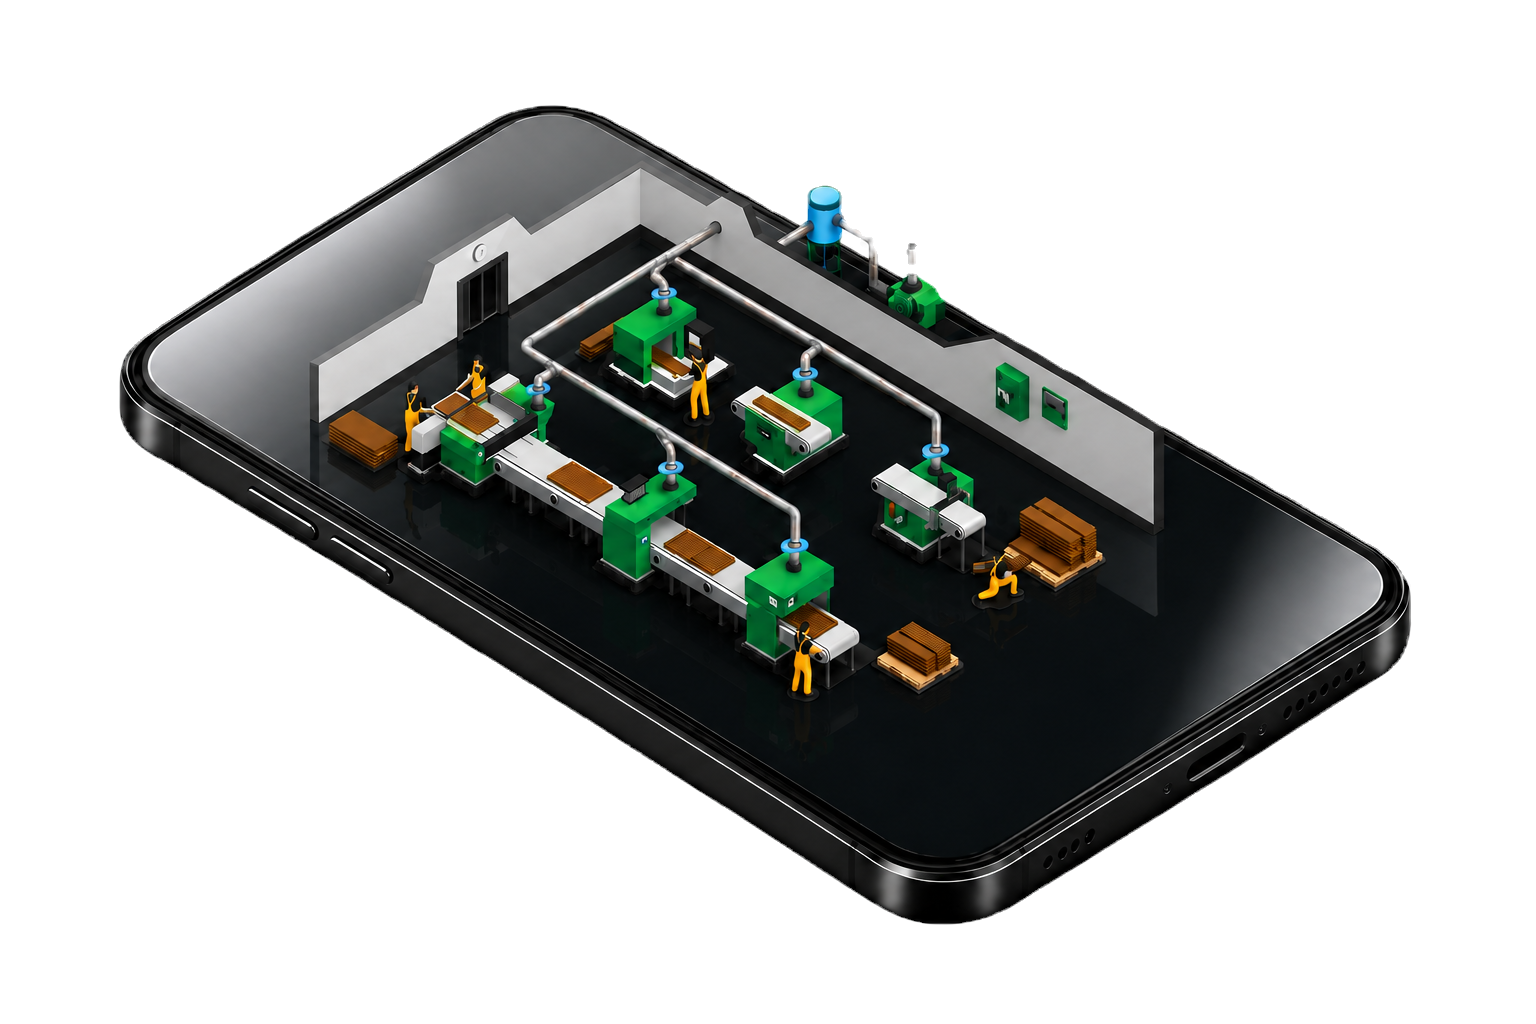
Depending on the system configuration, Ecogate can report fan power, calculated savings, system utilization, required air volume, measured velocity, fan pressure, filter pressure, workstation activity, gate status, and connected-device health. Gate-level airflow measurements require the appropriate Smart or Precision Airflow Gate configuration and calibration.
The Power Master VFD reports actual fan power to the greenBOX. The system compares measured power with the configured baseline and accumulates the difference while the VFD is running. Savings from times when Ecogate shuts the fan off completely may not be included in that running-VFD calculation.
Workstation utilization is sensor-active time divided by dust-collection system runtime. It is intended to represent the time a machine is actively producing dust, fume, or mist—not loading, unloading, programming, or maintenance time. Because periods when the entire system is stopped can be excluded, it can overstate utilization relative to the full shift.
Current greenBOX systems store data directly on the greenBOX in a time-series database at one-second resolution. Data for the previous 12 months is available for download at five-minute resolution. When cloud services are used, data transmission is encrypted.
No for the built-in DataMining view. Current Adelie greenBOX systems provide on-board browser access to trailing-12-month charts and CSV exports. Cloud connectivity is required for the Ecogate Analytics cloud platform, remote historical access, and related cloud reporting features.
Yes. Ecogate Analytics can present multiple ventilation systems on one page, while greenBOX Max and Master configurations can also manage multiple systems subject to model capacity and engineering design.
For Smart Systems, access to the web-based Ecogate Analytics platform is included with current ecoCARE plans. Availability depends on the greenBOX platform, internet connectivity, and an active service plan.
No software dashboard by itself guarantees compliance. Ecogate data can support documentation and reporting by showing airflow, pressure, velocity, and operating history. Final compliance depends on system design, material, configuration, calibration, operation, maintenance, and applicable requirements.
Talk with an Ecogate specialist about the measurements, reporting, and service plan that fit your ventilation system.